A common practice is to pull groups of kids who failed a TEK/Question for RTI or tutoring. That approach makes about as much sense as baking a cake without sugar or eggs and trying to add them in after it's already cooked. It makes about as much sense as baking a cake with rotten eggs and trying to take them out after the frosting is spread and the slices are on the plate. Let me be blunt: Waste. Of. Time. That will do NO ONE any good if we don't have a high view of what caused the problem in the first place.
Our data analysis should first pinpoint WHY students did not do well and direct us to models of instruction that are the beginning places for TIER ONE instruction so these results don't happen again. The data must inform the content and instructional expertise of the teacher.
Most teachers hate data meetings because they don't walk away with lessons, just more groups and more needs and more work and more failures. They don't like the meetings because the data analysis doesn't help them when they are face to face with students. Teachers know data meetings are a debilitating waste of time that sucks the energy and joy out of their lives. They grit their teeth, endure the humiliation, and wait until they can get back to TPT or Pinterest to copy some workshits for the tutorial groups they know they are going to have heaped on top of their already long list of duties.
Why can't our data analysis should tell teachers what they need to know and do about the results? As a curriculum leader, there are some things that you can do to help teacher interpret the data and prepare materials that can lead to a more productive struggle.
_________________________________________________________________________________
- After you receive your STAAR data, run an item analysis for the entire grade level.
- Print it out on poster paper, or tape it all together so that you can see all the data at once.
- Visually scan the document. DMAC and Eduphoria will "color" the cells to indicate areas of concern.
- Look at the rows that have 10 or more students
- Do you see any rows that have more or less red than the other rows? More red means this subpopulation struggles to make distinctions between good answers and best answers?
- More or less gray? More gray means that this subpopulaton is doing a better job at eliminating distractors.
- Look at the columns (questions/items)
- Do you see columns that have more or less grey than the other columns? More grey means that this item is probably not your biggest concern. Students are doing well on items like this.
- Examine each question for the whole group population. This will help you find out what’s going wrong with the questions. Each type requires a different instructional approach.
- Students choose the wrong answer more frequently than the right one.
- The TEK has not been taught.
- The TEK has not been taught correctly.
- Teachers do not understand the TEK.
- The instructional materials do not match the rigor of the test.
- The academic language of questioning during instruction does not match how the item was phrased.
- There are distractors over 18. Student have a misconception about this TEK (paired with this genre for ELAR). There are four types
- When the percentages spread pretty evenly over all four answer choices: 25/25/25/25, students are guessing. They are reading and considering all of the answers like we ask them to, but they honestly don’t know how to figure out the answer.
- When one of the answer choices is close to 0 and the rest are spread evenly over the remaining three choices: 0/33/33/33, students can eliminate the wrong answer, but they are having trouble discerning the differences between the remaining items.
- When most student get the answer correct, but a large group picks the same alternate answer: 71/10/19/0, you have a true distractor Students have a legitimate pseudoconcept or misunderstanding that needs to be directly addressed in whole group and small group instruction.
- When two answers, including the right answer have about the same percentage: 46/4/46/4, students can eliminate the worst answers, but struggle in selecting between the good/probable answer and the best/correct answer.
- Examine the subpops below the whole group percentages for each item. Do not consider subpops with less than 10 students.
- Do any subpops score 10% above the whole group percentages?
- Do any subpops score 10% below the whole group percentages?
- Consider this example: It’s not the SPED kids that are causing this score to be low. It’s not the females either. Perhaps there is some kind of gender-based, cultural/linguistic issue here with the Hispanic males in this group. It might be a good idea for the Hispanic females to work in pairs with Hispanic males in a small group intervention to explain how they think through this question.
- ALL: 76.32
- AA: 78.95
- Hisp: 58.33
- Female: 93.33
- Male: 65.22
- SPED: 72.73
- 81-100% Enrichment: Students need enrichment and sensory experiences to extend their learning
- 71-80% Quadrant 3 and 4: Students need more collaborative and independent practice. Make sure to bring kids back to whole group to debrief the processes they used, how they solved problems when they ran into difficulty, etc.
- 61-70%: Transfer: Students need practice with novel and engaging items and experiences. They know how to do the skill as it was taught, but not when it looks different or is paired with a different genre/stimulus.
- 51-60% Quadrant One and Two: Students need to see more models of proficient thinking and success criteria. Students need more shared (teacher focuses on leading the content and evaluating the answers given by the group) and interactive practice (where the teacher moves to asking questions about how kids decide what to do and when, how kids know if they are right, etc) with the whole group on grade level concepts.
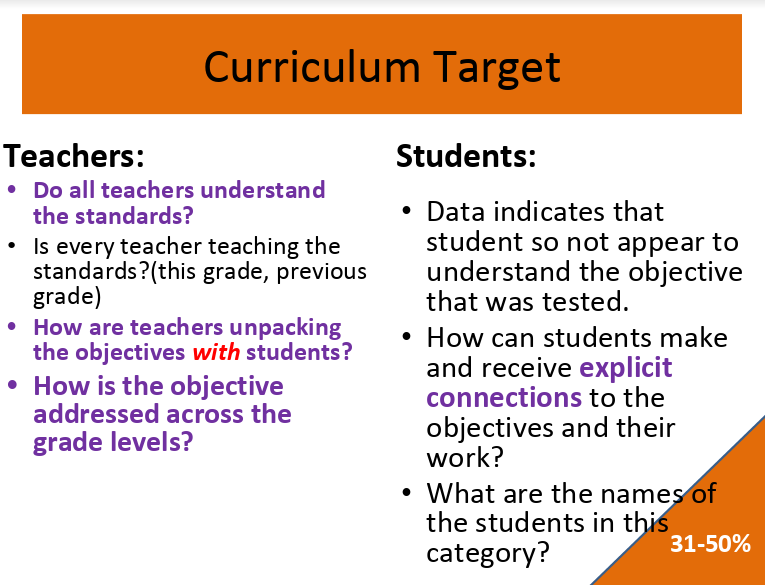
- 31-50% Curriculum Target: There is something going on with how we understand and apply the curriculum in the grade level. There also might be something taught in a previous grade level that interferes with how the TEK grows in complexity in the next grades. There also might be a testing strategy that we are using that is ineffective. Plugging in vocabulary words on multiple choice items comes to mind.
- 0-30% Drawingboard Target: Something very significant is happening with how everyone understands the TEK, the instructional methods, and the instructional materials, and perhaps even the scope and sequence.
- Prioritize
- Mark all of your Readiness TEKS
- Mark all TEKS that are assessed more than once. (Lead4Ward frequency distribution tables can help you with this as well.)
- I do NOT recommend using the Summary Tables that combine the percentages for each TEK. These percentages can hide conceptual and instructional considerations that are behind the low scores.
- Using all the considerations in the data analysis above, pick three TEKS that you feel will make the most difference in raising scores.
- Prepare Materials for the PLC
- Record your campus data for each answer choice.
- Create a document for each cluster of prioritized TEKS from step 7
- Copy and paste the questions from the IQ onto the document.
- Create an Item Narrative that turns the data you analyzed into sentences. Here is an example: Item Narrative: 95% of the students can eliminate the worst answer so we know that they are trying. 47% of the kids get the answer correct, but 28% of them land on D as an answer choice. This means that there is something significantly disconnected with student understanding/or instruction that is causing the problem. By examining what caused student to pick answer choice D, we can address this misconception with reteaching. The data also suggest that we need to look back at what this TEK means in light of both the KS and SE. We must also look at the genre. Notice that this was a paired passage. We might need to look and see if students were getting confused between the two selections. The data indicate that we have a problem with understanding the TEK and need to ask the following questions:
- Create a model analysis for the first question. (Look at the text evidence if there is a passage. Find support for the right answer in the text and evidence to refute the wrong answers.) Name the logical fallacies, flawed thinking processes, and text taking/content procedural errors. Here is an example: Overarching Comments: Kids have problems with these kinds of items because we are teaching the student expectations without consideration for the knowledge and skills statements. In this question, kids must use summarization as a comprehension strategy to identify the main idea of a portion of the text that spans only two paragraphs. If we are only teaching kids how to summarize so they can write or identify a summary, that’s not going to work. If we are only teaching kids how to identify a main idea of one paragraph, that is not going to work. If we are only teaching kids to identify main ideas, that isn’t going to work either. We have to teach kids to use main ideas across several paragraphs to make inferences about the author’s message and purpose.
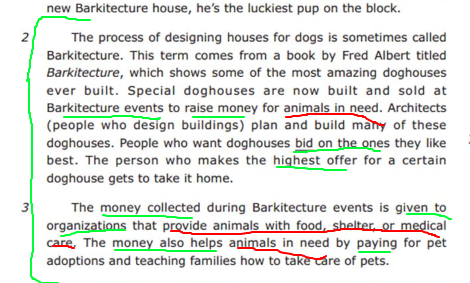
- Encourage people to become pet owners: When you understand the point of the whole passage, you know that the author isn’t writing about Barkitecture events to convince people that they need to get a pet. First, kids have to find the section(s) of the text that talk specifically about Barkitecture events. Which is only TWO paragraphs. Then they need to scan an mark the text for evidence that the author is trying to show us that Barkitecture events make people want to get a pet. There is nothing in there about people wanting pets - only those who want the doghouses. That makes me think (infer) that the people already have a pet or they have already decided to get one. Implications for teaching: Teach kids to identify and summarize sections of texts, not just whole texts. Teach kids to summarize expository text too. Teach kids how to use summaries to help comprehend. Teach kids to use summaries and main ideas to make inferences that help the reader reject wrong ideas.
- Raise money to help animals: Kids need to identify the specific sections of the text the question references. They need to realize that it’s not asking about the whole passage. Then they need to annotate the text to find all the evidence that supports this idea. Look at all the repetitive language and synonyms about the topic of money! Text evidence across multiple sections of text support this as the one true answer.
- Identify animals that need shelter: The distinction here is in the verb, /identify/. Conceptually, the passage does have specific language that shows that animals need shelter.
The language in the evidence here is repeated, just like in answer choice B. There is additional evidence to specify the types of need that the animals need. Students have to be using the summary to make the inference here. They have to think about the purpose this part of the text serves - which it to explain what happens at a Barkitecture event. They have to think about how this section of the text fits into the meaning of the whole text as well. Nowhere, in this section or the text as a whole, does the author even mention finding animals in need. Students may be just matching language in the text and in the passage. Reading is never a matching or seek and find game. You also have to THINK and REASON. Sure, there is direct evidence of “animals in need”, but the savy test taker pays attention to every word in the answer choice and thinks about the purpose of what the author is telling you. In this case, they aren’t telling you that animals are in need so that you can identify the animals that are in need. The purpose of mentioning animals in need in this text is to help the reader understand that animals in need are the beneficiaries of the doghouses sold at Barkitecture events.
- Create interest in building doghouses: Sometimes students get caught up in their own opinions and interests and schema. STAAR writers don’t care what kids are interested in. They care about whether or not students understand the text in front of them and why the authors made the choices they did. Instruction often focuses on kids making Text-to-Self connections. That is a comprehension strategy, not a strategy that helps you pick a right answer on a multiple choice exam. And, like the rationale mentioned for item C, students must think about ALL the language in the sentence stem and connect it to the evidence about the author’s reason for including that evidence. The author in this passage is not mentioning Barkitecture events to get people interested in building doghouses. And in the specific passages that mention Barkitecture events are focused on explaining how these events work and why someone might want to attend the event as opposed to someone wanting to start building doghouses. That might be a reasonable thought and response of a person who attends one of those events, but that’s not what the author put those paragraphs in there for.
10. Create model solutions for this question. Here is an example: Sample Solution for Math:
A: Show what 6.1 looks like with concrete models, with fractions. Show 0.6 as a fraction and with models. Discuss reasonableness.
Steps in thinking: 6/10 - When I see a fraction, I need to remember that it is only PART of something. That means that this answer will only have stuff on the right side of the decimal.
 Decimals and fractions are like “No Boys Allowed signs. NO whole collections are allowed on the right side of the decimal.
B Show what 6.01 looks like with concrete models, with fractions. Show 0.6 as a fraction and with models. Discuss reasonableness.
Steps in thinking: 6/10 - When I see a fraction, I need to remember that it is only PART of something. That means that this answer will only have stuff on the right side of the decimal. I also need to understand the place value that is located to the right of the decimal. Could relate to money to understand the difference between the value of the 10ths and 100ths value.

C Show what 0.6 looks like with concrete models, with fractions.. Discuss reasonableness.
Steps in thinking: When I see the fraction 6/10 I know that it is PART of a collection so I know as a fraction that there will not be a number located in front of the decimal. I will only have numbers located to the right of the decimal.
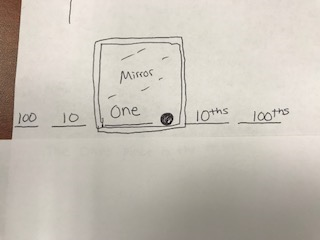
The ones place is the mirror. Everything reflects or bounces from this place to begin the mirrored image of the place value. There is only 1 “ones” place and not “oneths” place.
D Show what 0.06 looks like with concrete models, with fractions.Show 0.6 as a fraction and with models. Discuss reasonableness.
Steps in thinking: When I see the fraction 6/10 I know that it is PART of a collection so I know as a fraction that there will not be a number located in front of the decimal. I will only have numbers located to the right of the decimal. I also need to know the difference between the 10ths and 100ths place and where they are located. Refer back to money and mirror image.
11. Now you are ready for the PLC.